Turn Your Life Upside Down: An Individual Design Study
A downloadable version of this article can be read: Turn Your Life Upside Down: An Individual Design Study.
Abstract
An example of a Single System Design Study implemented using the following criteria;
Theory: Using a checklist and acquiring weekly personal accountability will help me to reach some of the goals that I would like to obtain.
Plan: Implement a personal growth checklist into my life, to help me keep some of the various aspects of my life in balance. The specific areas that I would like to work on are as follows;
- Read my bible daily
- Read my utmost for my highest every morning
- Eat one Salad or Smoothie as a meal each day
- Hit the snooze no more than once a morning
- Exercise five times per week for at least 30 minutes
- Meet with accountability partner once per week
By having a weekly checklist and somebody to be my accountability partner, I will be more likely to accomplish the preceding goals then if I was just to attempt to do the same things without any other change in my life.
Individual Design Study Methods
Turn your life upside down, is a series of self-care changes that were implemented in Jacob Campbell’s life. Campbell is 24-year-old male college student attending Eastern Washington’s School of Social Work. The study attempted to look at five aspects of his life that he attempts to do regularly. Each of these components of his life is not always followed but general goals he has had for his life for a number of years. The components studied are as follows; the number of snoozes used, daily bible reading, replacing a meal for a smoothie or salad, and finally five exercise activities per week. The fifth area studied was Campbell’s reading of a daily devotional. This was left out due to never once reading it through out the entire study.
To track Campbell’s practice of each of these topics figure one was filled out on a daily basis’s. The very act of participating in this activity causes a possible confound for the study. It itself seems to be a type of intervention. The intervention used was an accountability partner and weekly meetings. The concept is that if Campbell had to discuss either his failure or his success with another person, he would be more likely to participate in the helpful behaviors and not the unhelpful ones (hitting the snooze button).
The studies length was four weeks, from 30 April to 27 May. The first two weeks, were to gain a baseline and have some data points to compare to the data after the intervention. Figures 2 – 5 section A shows this baseline. Section B of figures 2 – 5 shows the studied points after the intervention. The x-axis shows the days of the study. The y-axis shows the number of times each of the various studied aspects was done. Utilizing the snooze button was the only negative based element studied. Figures 3 and 4 both are yes-no questions. A one means that the activity was done and zero means that Campbell did not participate in the activity. Figure 5 only has four plotted points. These points show the percentage of required exercise that Campbell completed. A score of one shows Campbell completing five out of five required exercises for the week.
Discussion of Results
The study was to find out if Campbell was more likely to engage in the described healthy lifestyle activities if he was required to meet with an accountability partner. The intervention of an accountability partner showed to be very effective for Campbell. It showed no effect in regards to his use of a daily devotional. This can be summed up by some of his reactions to the study. “I just didn’t feel like I’ve had enough time lately to fit in reading the devotional, even though it would have only really taken my less than 10 minutes” (31 May 2007, Personal communication).
Figure 2 looks at the number of times that Campbell utilized his snooze button in the mornings. He stated that this was the most important change he was hoping to accomplish. During the entire study, he hit the snooze as many as six times one morning. After the intervention, he only uses more than his one snooze three times. These are spread out and seemed to be sporadic spikes. Before the intervention he only had sporadic days that he obtained his goal.
Figures 3 and 4 both looked at the yes-no question of specific behaviors. Figure 3 was to see if Campbell replaced a meal with either a smoothie or salad. Before the intervention, Campbell rarely replaced a meal. After the intervention, he only failed to replace a meal for 2 days. Figure 4 looked at Campbell’s daily reading of the Bible. To qualify he had to read at least one chapter, but often read multiple chapters. Before the intervention, Campbell only missed a few days of Bible reading and missed even less than after the intervention.
Figure 5 describes Campbell’s consistency in exercising. He was required to exercise at least five times a week. The graph itself makes it seem as if it is the most progressive activity. Due to the fact that it deals with a specific number of times exercising a week, it has fewer points than the other graphs. The graph represents the percentage of those five weekly exercise activities participated in per week. The one obtained on week 4 means that Campbell completed five out of five exercise activities. The requirements for the exercise activity is that Campbell participated for at least 30 minutes in some activity that raises his heart rate above normal levels.
Conclusions
On the outside, it would seem that this experiment was a complete success. Campbell’s meeting with an accountability partner on every level of the study boosted the results. It would seem likely that if Campbell was to continue with this study, that the results might go down again. Although two weeks gives a number of plots to point in a chart, it does not mean that lasting change has been implemented.
Figures and Graphs
A copy of the data can be found as an Microsoft Excel document or as a Google Spreadsheet Document.
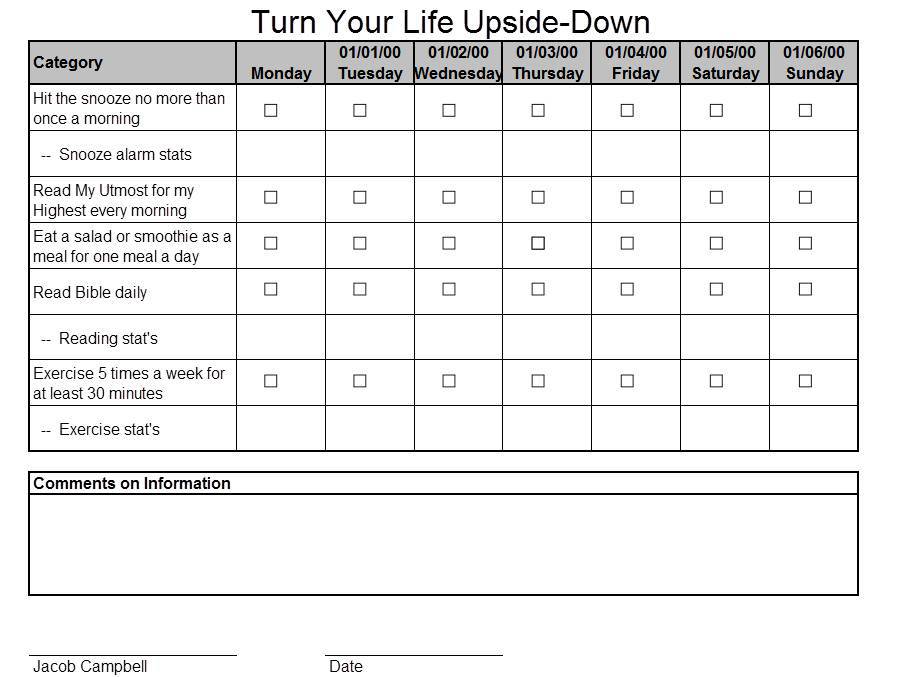 Figure 1: Example of daily checklist that Campbell filled out.
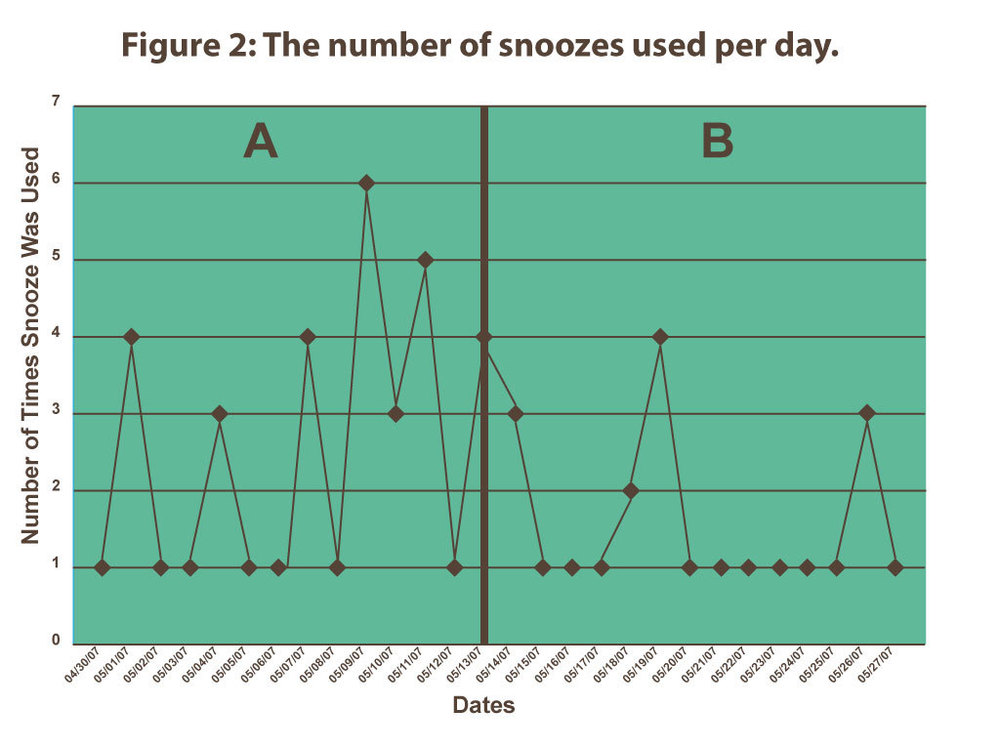 Figure 2: The number of snoozes used per day
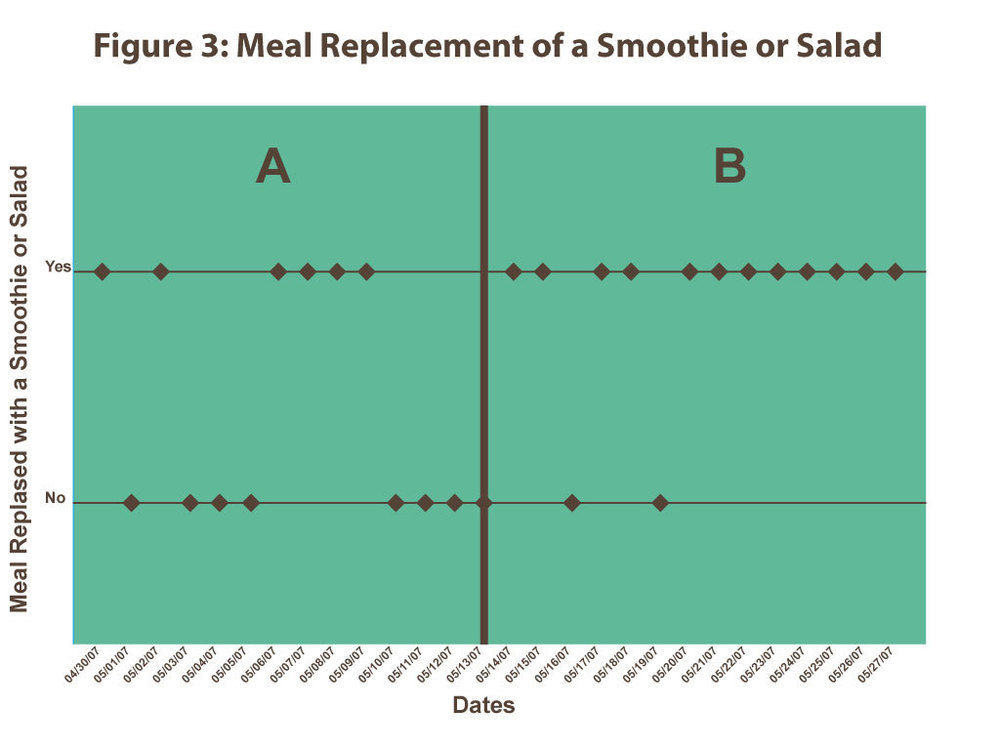 Figure 3: Smoothie or salad as a meal, displays if Campbell replaced a meal with a smoothie.
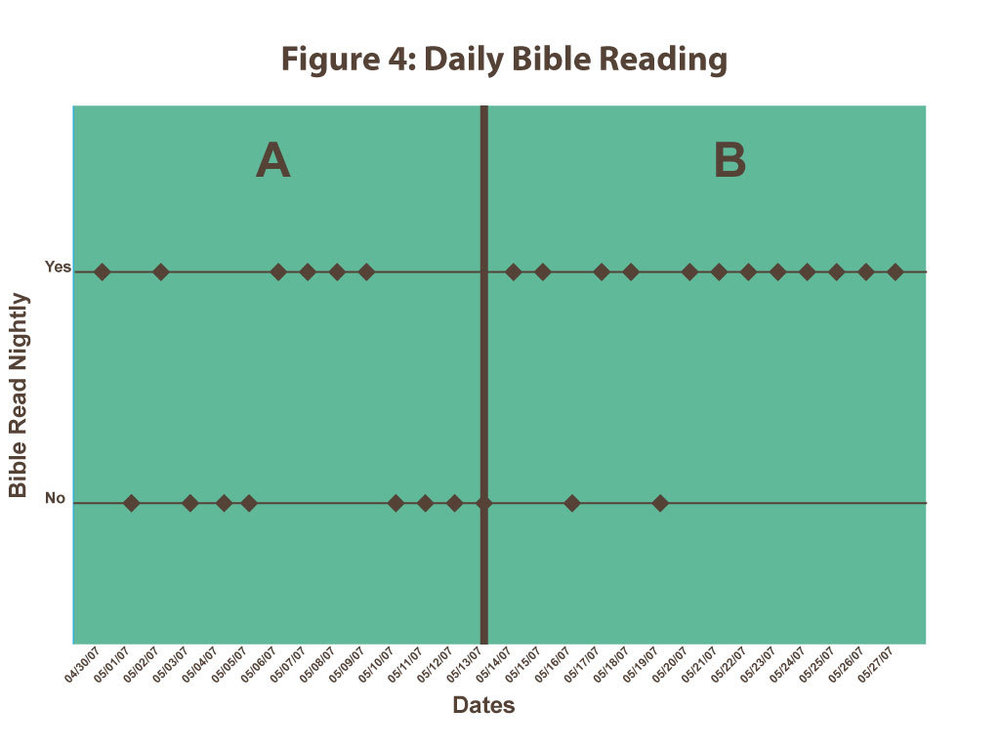 Figure 4: Daily bible reading, displays if Campbell had read his bible nightly.
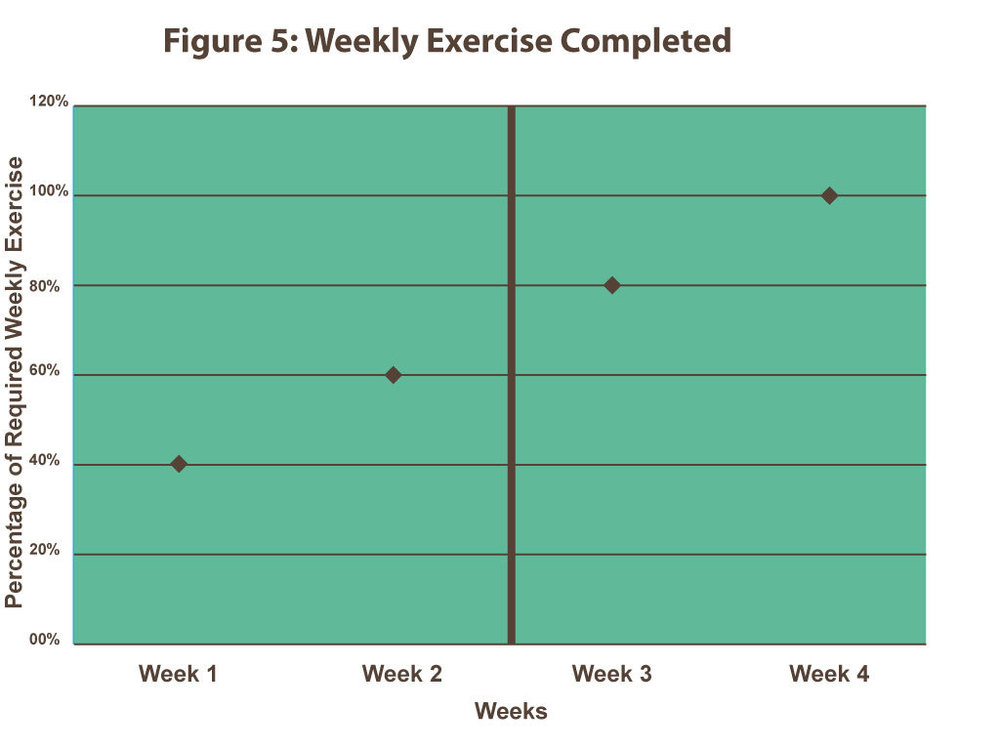 Figure 5: Weekly exercises, displays the percentage of 5 times per week that Campbell exercised.