Single System Design Studies
Basic Design
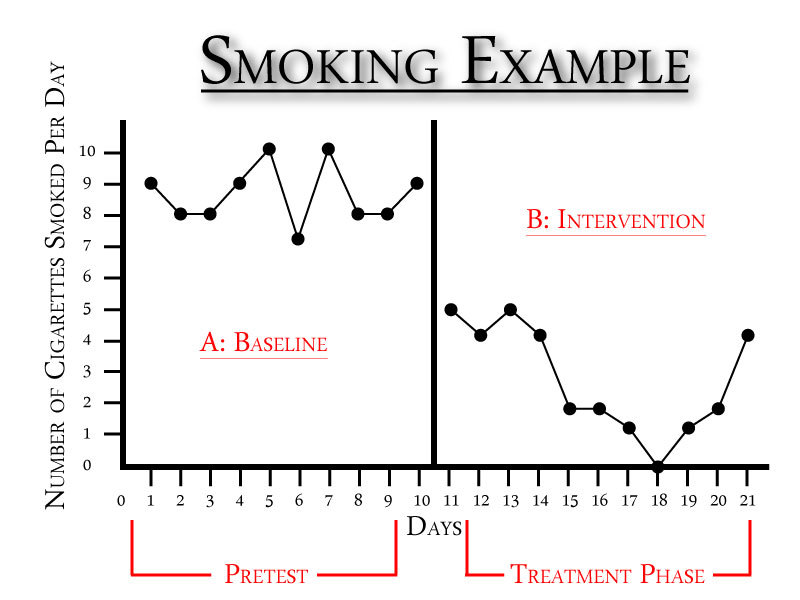 This line graph is to depict the line graphs that are frequently used in single system design studies (i.e. individual design studies). It was created in Adobe Illustrator. The graphic uses a smoking example with the number of cigarettes smoked on the Y axis and the days on the X axis. After 10 days, it shows that there was an intervention (the intervention could be something like the patch). The pretest phase is often labeled “A: Baseline” and the treatment phase is often labeled “B: Intervention.”
Single system design, sometimes referred to as Single subject design is a longitudinal study of one person, family, or group. It is a study of repeated measures with data collected over time. It is often utilized as for analyzing change between measurements. They have the following components:
- One participant
- The baseline is the measurement at pretest
- Intervention with measurement repeated
- Introduce treatment + measure / assess for improvement change in behavior
For example, if someone was to study the smoking habits of one person. In the graph below, the baseline is the amount of cigarette that the participate smoked a day before the intervention is implemented. After a period of time an intervention is implemented (i.e. utilizing the patch, nicorette gum… etc). Part B is known as the treatment phase. It shows the amount of cigarette smoked by the participate after the intervention.
For further information regarding single system design studies you can view the study I completed on myself, Turn Your Life Upside Down: An Individual Design Study.